
Data:
1. Chinese travel abroad through travel agency in first quarter 2016. http://www.bjstats.gov.cn/tjsj/yjdsj/ly/2016/201604/t20160418_347802.html
2. Foreigners come to China for traveling in first quarter 2016.http://www.bjstats.gov.cn/tjsj/yjdsj/ly/2016/201604/t20160418_347790.html
About data:
Top 10 popular countries chinese go traveling (2008-2010)
Japan
Korea
Thailand
France
Italy
Germany
Australia
Singapore
Malaysia
Philippines
Top 10 popular countries chinese go traveling (2011-2015)
Thailand
Korea
Japan
France
Italy
Switzerland
Singapore
Germany
Malaysia
Australia
Top 10 popular countries chinese go traveling (2016)
Thailand
Japan
Korea
America
Singapore
France
Italy
Switzerland
Australia
Malaysia
The amount of traveling Philippines didn’t increase significantly like others so the data is just collected from 2008-2010, totally four years. And Switzerland becomes a popular country to travel. The data of how many people went to Switzerland is from 2011-2016.America seems to become a popular destination for traveling among Chinese with the time past. The data of how many Chinese traveled America appears in the table in 2016.
What does your intended audience want or need to know?
Top ten popular countries among Chinese for traveling.
top 1 red
others : come green; go yellow.
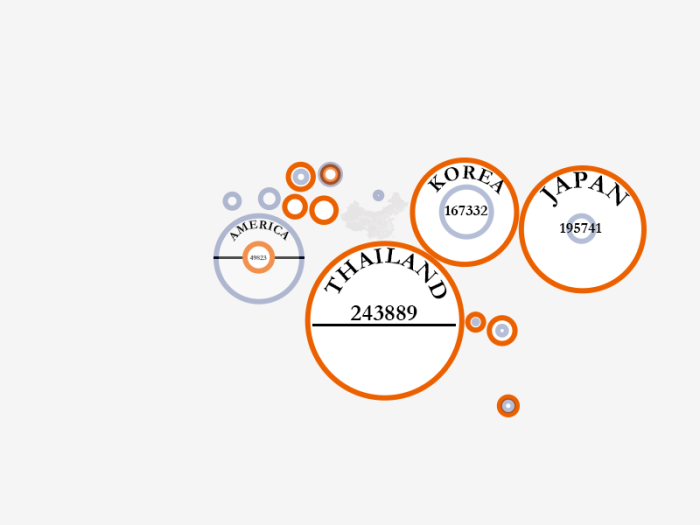
I want to put two sets of data together and choose this way to show. But I find maybe I can get rid of the geo-location. It’s not really important to my audience.
However, I found it’s wrong to simply make the value of diameter double or several times than the other when the amount is double or several times than the others!

The Ranking of Perceptual Tasks
Qualitative Nominal:
- Position
- Colour(Hue)
- Pattern(Texture)
- Connection/Edge
- Containment
- Pattern(Density)
- Colour(Lightness)
- Symbol/Shape
- Size(Length)
- Angle/Slope
- Size(Area)
- Size(Volume)
Qualitative Ordianl
- Position
- Pattern(Density)
- Colour(Lightness)
- Colour(Hue)
- Pattern(Texture)
- Connection/Edge
- Containment
- Size(Length)
- Angle/Slope
- Size(Area)
- Size(Volume)
- Symbol/Shape
Quantitative Interval,Ratio
- Position
- Size(Length)
- Angle/Slope
- Size(Area)
- Size(Volume)
- Pattern(Density)
- Colour(Lightness)
- Colour(Hue)
- Pattern(Texture)
- Connection/Edge
- Containment
- Symbol/Shape
encoding attribute of Length is ranked higher than the attribute of Area.
It is easier to spot the associations through variation in colour than variation in shape.
About 3D decoration-Using psuedo-3D effects in your chart when you have only two dimensions of data means you are simply decorating data.
Sometimes the 3D version makes it much harder to form accurate judgements.
